LED light intensity

booms111

Well-Known Member
I dispelled this myth recently:


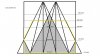
This is what you get with a single 200W light source
View attachment 4125362
The 1000 to 500 uMol zone is 12" deep.
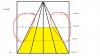
Here is what four 50W light sources looks like:
View attachment 4125368
You'll notice that while you still have 250 uMol at the floor, the 1000 to 500 uMol zone is higher and stretched out. the "zone" is closer to 18" in depth.

Lets see what eight looks like:
View attachment 4125374
As you can see - the floor is still at 250 uMols, and the "zone" is stretched to about 21".

In reality, penetration is not about having a high initial intensity single light source - its about how many PAR watts you're putting in and how uniform you can spread those photons.
I'd like to see the uMols for the areas I circled in red and how 2 lights running at 100w would compare to your graphs. Id assume that all light sources(hps,cob,qb,strips) graphs would look different from each other with cobs being one of the most beneficial lights to run more of a group with the lower amount of spread they have compared to say a hps with a hood. Thanks for graphs and info.
20180422_012213.jpg
 
Last edited:

wietefras

Well-Known Member
I dispelled this myth recently:
...
In reality, penetration is not about having a high initial intensity single light source - its about how many PAR watts you're putting in and how uniform you can spread those photons.
I don't see how those drawings have any bearing on reality.

Beam angles are not 55 degrees but 115 degrees. For HPS even 140 degrees. So you are measuring only small beams instead of all the light. In reality there will be reflection, which means that the HPS beam also gets augmented by light from the walls.

Once the light hits the canopy it starts to get absorbed by the plants. There is no drawing that can simulate that. At best you can estimate it by using the LAI.

Those charts show how multiple light sources quickly negate the effect of "inverse square law" in free air. That's really the only thing it does. Other than that it's way too incomplete to be an actually useful simulation of light.

There really is no difference in how the light drops off with height once you reach correct uniformity. From that level onwards it's wall losses which cause the light to disappear (or plant absorption). Those are the same whatever the number of lights sources you used.

The difference that does exist and is actually important is the incident angles of the light hitting the canopy. Shallower angles move under the leaves easier than steep angles. That's a lot more difficult to simulate, but just moving the light up and down you quickly see that when the light is higher there is less penetration. Which to mee makes sense since when the light is closer by the light at shallower angles has better access to the canopy.
 

ANC

Well-Known Member
The spacing between the light sources is very important in terms of summing the light together.
One of the reasons I like the F strips more than most of the boards with the diodes far apart from each other.
 

InTheValley

Well-Known Member
best penetration is light from top and light at sides, like wietefras, says, its about the point of the angle. You throw cobs to angle focus, you get PURE penetration, from all angles possible. again, this is where the sun rise and sun set hits those hidden, or covered buds when the side angle is truly an side angle and not from the top only.

In a enclosed area, its harder to hit those, because we dont have room. QBs or strips run super low, to not burn the plants at 3-4 inches would be best.

Even if you took the QB or any Samsung strip or board for that matter, and layed some 3mm Solexx greenhouse panels to ensure the plant matter doesnt come in contact, and would also help tremendously in the distribution and spectrum mix of the light.

be a cool project if your looking for true maximum penetration.
 

OneHitDone

Well-Known Member
best penetration is light from top and light at sides, like wietefras, says, its about the point of the angle. You throw cobs to angle focus, you get PURE penetration, from all angles possible. again, this is where the sun rise and sun set hits those hidden, or covered buds when the side angle is truly an side angle and not from the top only.

In a enclosed area, its harder to hit those, because we dont have room. QBs or strips run super low, to not burn the plants at 3-4 inches would be best.

Even if you took the QB or any Samsung strip or board for that matter, and layed some 3mm Solexx greenhouse panels to ensure the plant matter doesnt come in contact, and would also help tremendously in the distribution and spectrum mix of the light.

be a cool project if your looking for true maximum penetration.
That sounds interesting and similar to the approach used in this Philips Aquarium led.
But the issue is the "efficiency nazi's" loose their edge when you start putting anything between the led's and the plants.
The dude in this vid sums up the "efficiency" vs "Quality" or "Performance" argument pretty well imho


InTheValley

Well-Known Member
maybe 10%, but the gain, id imagine would be phenomenal. and like I said, the panels distribute the light in a more scattered fashion, then direct, .. This is why i said Solexx, its supposed to be the best in the market. all i know is, BigGreenThumb killed it with side lighting using strips.

Thanks for the Vid, ill check it out, no time right now,..
 

nfhiggs

Well-Known Member
I'd like to see the uMols for the areas I circled in red and how 2 lights running at 100w would compare to your graphs. Id assume that all light sources(hps,cob,qb,strips) graphs would look different from each other with cobs being one of the most beneficial lights to run more of a group with the lower amount of spread they have compared to say a hps with a hood. Thanks for graphs and info.
View attachment 4125391
There is no light in those areas, its outside the light cone.
This is just an idealized example that demonstrates how multiplying the emitters and spreading them out while maintaining the same total output affects light distribution and intensities in an enclosed reflective space - I.E., a grow tent. Its not meant to be a perfect representation of reality - that's far more complex. Its just an example of the concept, using idealized components.

Two 100W emitters looks like this:

two cob.jpg
As you can see, this results in a bright "hot spot" in the center.


An HPS hood is simply an attempt to spread the single sourced light over a wider distribution area. Multiplying the emitters and reducing their power, while maintaining the same overall power is simply a more efficient way of achieving the same goal.
 
Last edited:

booms111

Well-Known Member
There is no light in those areas, its outside the light cone.
This is just an idealized example that demonstrates how multiplying the emitters and spreading them out while maintaining the same total output affects light distribution and intensities in an enclosed reflective space - I.E., a grow tent. Its not meant to be a perfect representation of reality - that's far more complex. Its just an example of the concept, using idealized components.

Two 100W emitters looks like this:

View attachment 4125590
As you can see, this results in a bright "hot spot" in the center.


An HPS hood is simply an attempt to spread the single sourced light over a wider distribution area. Multiplying the emitters and reducing their power, while maintaining the same overall power is simply a more efficient way of achieving the same goal.
Do you know if reducing the wattage decreases the uMols evenly like your graphs? So for example taking a 200w cob that has 1000 uMols at 2ft then reducing the power to 100w like your graph showing 500 uMols at 2ft, a 50% drop in wattage equalling 50% less uMols. That doesn't seem possible to me but maybe since I'm still learning the LED lighting.

What's the uMols graph on four 250hps vs 1k hps? I don't believe that one thousand watts of 250hps can ever equal a single 1k hps but i could be wrong on that also.
 

nfhiggs

Well-Known Member
Do you know if reducing the wattage decreases the uMols evenly like your graphs? So for example taking a 200w cob that has 1000 uMols at 2ft then reducing the power to 100w like your graph showing 500 uMols at 2ft, a 50% drop in wattage equalling 50% less uMols. That doesn't seem possible to me, yet.
Yes, that is exactly how it works, assuming equal efficiency of the lights - half power equals half the photon density at the same distance - assuming ideal components.
What's the uMols graph on four 250hps vs 1k hps? I don't believe that one thousand watts of 250hps can ever equal a single 1k hps but i could be wrong.
Again this is not meant to represent any particular light in reality - its a mathematical modeling.

In reality, with LED's efficiency increases as you reduce power by 50%(in the same component) by about 10%, while HPS efficiency descreases with wattage.

So you are correct in assuming four 250W HPS will not equal one 1000W *in reality*, but its not for the reason you may think. The reason is that 250W HPS bulbs are about 20% (or more) less efficient than 1000W bulbs - around 115 lm/w vs 140 lm/w.
 

Slinging PAR

Well-Known Member
This is why a PAR meter is necessary. Too many things involved easier to just take a measurement at the leaf.

You should only expect light planning to bring you within 10-15%; the remaining improvements you can get from other techniques like LST.
 

giantsfan24

Well-Known Member
Do you know if reducing the wattage decreases the uMols evenly like your graphs? So for example taking a 200w cob that has 1000 uMols at 2ft then reducing the power to 100w like your graph showing 500 uMols at 2ft, a 50% drop in wattage equalling 50% less uMols. That doesn't seem possible to me but maybe since I'm still learning the LED lighting.

What's the uMols graph on four 250hps vs 1k hps? I don't believe that one thousand watts of 250hps can ever equal a single 1k hps but i could be wrong on that also.
I asked this question of @RainDan last week and he said the rate of decrease isn't even. I don't know what the formula is. Noob here..
 

wietefras

Well-Known Member
There is no light in those areas, its outside the light cone.
That's just not true. Our lights don't have a 55 degree beam angle. I's usually 115 degree for the leds and 140 for the HPS. So, you're missing most of the light in those charts. Plus it's missing reflection.

Those drawings show nothing real world relevant. Other than perhaps that inverse square does not apply if you have multiple light sources, but that nut is not here anymore.
 

wietefras

Well-Known Member
This is why a PAR meter is necessary. Too many things involved easier to just take a measurement at the leaf.
No you don't. Light intensity is not an exact science. Plants can deal with anything between 200umol/s/m2 and 1500umol/s/m2.

Simply make sure uniformity is ok. Which you can do with a lux meter or simply apply the rule of thumb that lights should not be higher than the spacing between the rows of leds. Then you can estimate intensity by dividing PPF by surface area. Or deduct some (10% to 25%) for walls losses.
 

Slinging PAR

Well-Known Member
No you don't. Light intensity is not an exact science. Plants can deal with anything between 200umol/s/m2 and 1500umol/s/m2.

Simply make sure uniformity is ok. Which you can do with a lux meter or simply apply the rule of thumb that lights should not be higher than the spacing between the rows of leds. Then you can estimate intensity by dividing PPF by surface area. Or deduct some (10% to 25%) for walls losses.

Well it is by definition an exact science. But I understand the point you are trying to make. You could avoid using a PAR meter entirely and read the plants, but for newer growers they just don't have the experience and could use a little guidance and all the help they can get.

You can avoid wall losses entirely if you have plant material between the light source and wall.
 

Slinging PAR

Well-Known Member
Do you know if reducing the wattage decreases the uMols evenly like your graphs? So for example taking a 200w cob that has 1000 uMols at 2ft then reducing the power to 100w like your graph showing 500 uMols at 2ft, a 50% drop in wattage equalling 50% less uMols. That doesn't seem possible to me but maybe since I'm still learning the LED lighting.

What's the uMols graph on four 250hps vs 1k hps? I don't believe that one thousand watts of 250hps can ever equal a single 1k hps but i could be wrong on that also.

Not necessarily a 50% drop in uMols. Depending on LED quality, halving the electrical power will only reduce the light power 35-45% which is why we run them low for better efficiency.

The diagrams are just simplified to show the value of light source distribution. CoBs being high density can be crammed close together as you need versus strips/boards that are distributed at fixed points. Use which is best for your conditions.
 

nfhiggs

Well-Known Member
That's just not true. Our lights don't have a 55 degree beam angle. I's usually 115 degree for the leds and 140 for the HPS. So, you're missing most of the light in those charts. Plus it's missing reflection.

Those drawings show nothing real world relevant. Other than perhaps that inverse square does not apply if you have multiple light sources, but that nut is not here anymore.
Which part of "this is an illustration of a concept using ideal components" do you not get? Its not MEANT to represent any actual light, its simply an illustration to show how light overlaps from multiple sources and reflects back into the grow space from reflective walls.

The reflections are there you just missed them. Like you missed the whole point.
 

wietefras

Well-Known Member
Which part of "this is an illustration of a concept using ideal components" do you not get? Its not MEANT to represent any actual light, its simply an illustration to show how light overlaps from multiple sources and reflects back into the grow space from reflective walls.

The reflections are there you just missed them. Like you missed the whole point.
The fact is that average light levels at any height are the same whether you use 1, 4, 8 or a million light sources. As long as the total initial amount of light is the same. So it is immediately clear that your "findings" are nonsense. The only reason you get those "findings" is because your drawings are incomplete.

The only thing that actually changes with more light sources is the light distribution. The same amount of light gets distributed more uniformly. That's all.

Although that has a knock on effect that you can have the lights closer to the canopy. Which reduces wall losses and therefore improves "penetration". Plus the angles are better.

:edit:
Below a proper simulation of 8, 3 and 1 light source. The chart starts from the point where proper uniformity is achieved (and therefore where the canopy would be). The depth of the chart is 40cm.

Red is max intensity and green is least:
LightSource_Simulation.jpg
Same relative "penetration" for 8, 3 or 1 light source.
 
Last edited:
Top