Math behind
- Thread starter alesh
- Start date
Greengenes707
Well-Known Member
What has Google told youThanks SupraSPL, that was really helpful!
Still didnt grasp what the SPD graph really means.
I mean, if a certain wavelengh has for example 100%, is it 100% of what?
I apologize again for the basic question...
alesh
Well-Known Member
100% marks the wavelength with the maximum output. The other values are relative to this one.Thanks SupraSPL, that was really helpful!
Still didnt grasp what the SPD graph really means.
I mean, if a certain wavelengh has for example 100%, is it 100% of what?
I apologize again for the basic question...
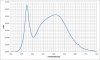
It would make more sense if the SPD were normalized to have integral of 1. Then the y values would be ratios of output of each wvl to overall output. For example the peak wvl in the chart below is 454nm with y value of 0.66%. That means that 0.66% of the whole output is being put out at 454nm.
CanadianONE
Well-Known Member
One quick question with the math excel file, The only numbers we must change are column A & B which we import from digitizer once we digitize a chart? All other numbers remain untouched.100% marks the wavelength with the maximum output. The other values are relative to this one.
It would make more sense if the SPD were normalized to have integral of 1. Then the y values would be ratios of output of each wvl to overall output. For example the peak wvl in the chart below is 454nm with y value of 0.66%. That means that 0.66% of the whole output is being put out at 454nm.
View attachment 3482264
alesh
Well-Known Member
Only column B has to be changed.One quick question with the math excel file, The only numbers we must change are column A & B which we import from digitizer once we digitize a chart? All other numbers remain untouched.
guod
Well-Known Member
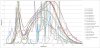
spectrum imported to the silvania Tool...all ya need
CCT for this SPD is 3500K
LER is 276 lm/W
and we have 4.83 µmol/W
alesh
Well-Known Member
And now who should we believe...spectrum imported to the silvania Tool...all ya need
CCT for this SPD is 3500K
LER is 276 lm/W
and we have 4.83 µmol/W
View attachment 3486098
The SPD chart is from the CXA3070 data sheet (3000K 93CRI although CXB3070 3000K 90CRI has the same). There isn't any 3500K chart in the data sheet.
And yes I'm getting CCT of 3400K as well, LER 276lm/W. There's some discrepancy, though, as I'm getting 4.91 µmol/J from the 380-780nm range or 4.51 µmol/J from the 400-700nm range.
With Veros v2 I'm always getting lower CCT than a chart claims. Such as 2532K for 3000K chart or 3278K for 4000K chart. The calculation works reasonable well for standard-CRI Crees.
churchhaze
Well-Known Member
It's because it's relative SPD, not absolute. For absolute SPD, the area under the curve is total power output.Thanks SupraSPL, that was really helpful!
Still didnt grasp what the SPD graph really means.
I mean, if a certain wavelengh has for example 100%, is it 100% of what?
I apologize again for the basic question...
Edit: just realized this was answered...
EfficientWatt
Well-Known Member
Hi @alesh,
Have you worked out LER and QER for any of the (newish) 315W CMH/CDM/LEC (whatever it should be called) ? I'm curious to compare.


Have you worked out LER and QER for any of the (newish) 315W CMH/CDM/LEC (whatever it should be called) ? I'm curious to compare.
Can you share them pleaseNo need for a new thread. I can share them if someone's interested.
Last edited:
alesh
Well-Known Member
Nope, I felt no need. The horticultural ones have all the relevant data in the spec sheet.Hi @alesh,
Have you worked out LER and QER for any of the (newish) 315W CMH/CDM/LEC (whatever it should be called) ? I'm curious to compare.
Can you share them please
All the SPDs are packed in the .zip as a .csv file.
Attachments
-
33.9 KB Views: 130
CanadianONE
Well-Known Member
Any tips on how you create your SPD's like in the picture? You using excel for that?Nope, I felt no need. The horticultural ones have all the relevant data in the spec sheet.
All the SPDs are packed in the .zip as a .csv file.
View attachment 3487491
alesh
Well-Known Member
Yep Excel. Insert>Chart>Scatter>Smooth line in Excel 2007.Any tips on how you create your SPD's like in the picture? You using excel for that?
CanadianONE
Well-Known Member
Thanks I am playing around with it now. Excel 2013 and I have a chart just trying to figure out how to only show the data I want and not have a blank section without data plotted for example its showing my wavelength axis from 0 to 700 but I want to omit the blank section from 0 to 400 and only show 400-700. I will get the hang of it eventually lolYep Excel. Insert>Chart>Scatter>Smooth line in Excel 2007.
alesh
Well-Known Member
Right click on the axis > Format AxisThanks I am playing around with it now. Excel 2013 and I have a chart just trying to figure out how to only show the data I want and not have a blank section without data plotted for example its showing my wavelength axis from 0 to 700 but I want to omit the blank section from 0 to 400 and only show 400-700. I will get the hang of it eventually lol
CanadianONE
Well-Known Member
@alesh could you have a quick look at the excel file I have attached, This is my first attempt at using your math file that you shared. Just want to make sure I am on the right track with it. I digitized a cheap Chinese COB chart to get these less them dismal numbers lolRight click on the axis > Format Axis
Attachments
-
30.7 KB Views: 39
bggrass
Well-Known Member
Hi alesh, and all, when you run the integrals posted at the beginning of this thread, the PAR values and umol/s values that you get, are those the values at the source of the light? i.e at the cob's surface. Do we setup another integral with the par or umol values inside to get the values at 12" , 18", 24"?
alesh
Well-Known Member
No these values are only for converting luminous flux to radiant energy and/or photon flux. You don't calculate photon flux density this way.Hi alesh, and all, when you run the integrals posted at the beginning of this thread, the PAR values and umol/s values that you get, are those the values at the source of the light? i.e at the cob's surface. Do we setup another integral with the par or umol values inside to get the values at 12" , 18", 24"?
speedyganga
Well-Known Member
Hello, Great share alesh, thank you !!
You calculate efficiency of each emiters, But what about efficacity ?
I mean, efficiency from a 660nm SSL @ 350mA is lower than a CXB3590@350mA but I guess we have to take into acount spectrum efficiency if we want to really compare them ?!
how can we calculate it ?
You calculate efficiency of each emiters, But what about efficacity ?
I mean, efficiency from a 660nm SSL @ 350mA is lower than a CXB3590@350mA but I guess we have to take into acount spectrum efficiency if we want to really compare them ?!
how can we calculate it ?
alesh
Well-Known Member
This thread isn't about efficiency of emitters themselves but rather that of spectra.Hello, Great share alesh, thank you !!
You calculate efficiency of each emiters, But what about efficacity ?
I mean, efficiency from a 660nm SSL @ 350mA is lower than a CXB3590@350mA but I guess we have to take into acount spectrum efficiency if we want to really compare them ?!
how can we calculate it ?
It's very hard to compare different light sources from the horticultural POV. The current consensus is that the most accurate measure is photon output meaning that a better light sources produce more photons per energy dissipated and each photon - regardless of its wavelength - has the same weight.
If we're to add photon weighing by its wavelength we need a function that would tell us how to weigh them [ie McCree's curve]. Could be done in a very similar way as lm->W or W->µmol/s conversion.