chazbolin
Well-Known Member
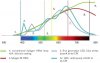
I have enjoyed many spirited discussions with members on this and other forums re the way plant lighting systems are field measured and how manufacturers publish their lamps output data. As a direct result of these discussions I recently was asked to help contribute to a paper that proposes how manufacturers might consider publishing their lamp's outputs in a format that identified output in the the three peak photosynthetic absorption regions. Think of it as like an N-P-K system for rating plant lighting.
http://www.inda-gro.com/pdf/MeasuringPlantLight.pdf
I think a comparison of the technologies as detailed within this documents 5 most common specification techniques implies that by relying on the numbers alone you can be left with a sense of one technology is 'better than another' for occupying that coveted space above our garden. However a closer analysis of the data reveals that if you've actually grown with the supposed 'superior technologies' plant response is dictated by forces greater than just a mfg claiming 'my number is bigger than yours so it must be better' type of marketing mentality. Which simply reinforces my belief, that at the end of the day, it will always comes down to plant response which does in fact, trump many of these claims.In developing this document we used manufacturer data that was available at the time of this publication from a variety of manufacturers websites. Nothing in this document is meant to construe that we are suggesting that any one technology is better than the other. Our interest in developing this document was to simply present another way of viewing how artificial plant lighting can be represented in a way that does not confuse the gardener with information and values that may be mostly irrelevant when it comes to selecting the best lamp for their needs.
http://www.inda-gro.com/pdf/MeasuringPlantLight.pdf