Measuring plant lighting
- Thread starter chazbolin
- Start date
tags420
Well-Known Member
I'll ask again...You don't need an integrating sphere to develop V-C-F. These values are achieved by knowing the lamps spectral distribution and factoring consumed watts verses it's efficiencies into turning electricity into plant usable light.
As a grow lamp mfg I might use an integrating sphere to easily determine PPF output. For general area lamp applications I would use it to determine a lamps lumen output. As an area light fixture mfg I would want an in situ value from an integrating sphere in lux/footcandles.
As a grow light fixture mfg however I would not be interested in area sphere data since they are for starters photopically corrected for human visual luminosity function. The area readings that a sphere gives you are designed for candela plot plans and are photopically adjusted. Furthermore they are providing intensity not spectrum in a numerical value. With plants you would want to know those intensity values in the 3 peak absorption regions and totaled as a PPF/s/total or PPF/s/region value which can be accomplished mathematically, as we have done on pages 6-7 of the charts, to provide the gardener with information that is unique to determining available energy within the regions of plant photosynthetic requirements.
I wan't to know how and where the values used to calculate the w/region come from. I just look at spectral graphs...how are they made, I thought a spectroradiometer was use...and that is taken at a distance(selsected by user), and based on the distance the spectrum perceived by the spectroradiometer is different. But then you went off about the sphere again.But how are those values achieved is my question? A spectroradiometer graph is taken at a distance and expressed in mW/m^2/nm. I am not arguing...just trying to clearly understand.
How is mW measured...then how does mW go to umols? Is is converted to photons then to back to umols. I just want to know how it all works so I can jump on board. When I see the ppf on the charts I really like it. There are some short coming but it is better than the past for sure.
chazbolin
Well-Known Member
One of the purposes of publishing this document was to show how much energy a lamp emits in the 3 regions of known photosynthetic absorption. Other than conversion efficiencies whereby electrical energy is converted to plant usable light within the 3 regions it does not delve into the differences between lamp construction, heat generated from the lamp, spectral stability over lamp life, and many other aspects of the decision making process that ultimately goes into the selection of what lamp will be used in your garden.Well cmh has a ceramic arc tube and mh have a quartz or aluminum arc tube. The ceramic arc tube is more resistant to corrosion and has a better and more even distribution of light. Cmh lasts twice as long with less degrading than mh. Cmh runs 2-3 times cooler in temp than mh. All cmh has far more red and deep red than the hortilux blue. Also cost half as much and run less watts. Calling a hortilux blue a cmh would be like saying a t5, t8, or t12 bulbs are induction bulbs.
so no go there my friend.
I am going to remove the Hortilux Blue 1000 we had posted on the graph because you're correct in that Eye-Hortilux classifies this lamp as a proprietary chemically modified Metal Halide lamp that while not utilizing a ceramic arc tube was chosen because we had never seen a MH SDG that came even remotely close to the SDG that the HB lamp was showing. A % comparison (wattage's don't matter the % are always the same) of the V-C-F values between these two lamps only put them off a few points which isn't an excuse for including the HB lamp but it was the reason it was selected:
1000w HB: 42-33-25
400w CMH: 32-38-31
Now this is off topic for this thread but if you want to contribute some thoughts as to how Eye-Hortilux is accomplishing this even distribution and R-FR with a MH lamp you have my attention.
Forgive the delay in my response but I stuck with the Integrating Sphere response because on the next update I'm going to publish the formulas used to get these values for each of the 5 metrics that we're used. They will be detailed and will require at a minimum a college level math background to use these formulas properly. I will also provide a simplified explanation to how these values are achieved. Between the advanced math and simplified explanations I expect that this methodology will be seen as sound science since it can be applied by virtue of having just the SDG and the consumed watts of any technology being evaluated.I wan't to know how and where the values used to calculate the w/region come from. I just look at spectral graphs...how are they made, I thought a spectroradiometer was use...and that is taken at a distance(selsected by user), and based on the distance the spectrum perceived by the spectroradiometer is different. But then you went off about the sphere again.
How is mW measured...then how does mW go to umols? Is is converted to photons then to back to umols. I just want to know how it all works so I can jump on board. When I see the ppf on the charts I really like it. There are some short coming but it is better than the past for sure.
Regarding the use of a spectroradiometer reading for the majority of lamp types the spectral distribution will remain constant as you move the sensor around underneath lamp. The wattage will change based on sensor distance to the lamp. What you will find with SSL panels is that spectral shifts will occur as the individual diodes distribution patterns will have an effect on the spectrums being displayed depending upon precisely where the sensor is located beneath the panel. Depending on the panel manufacturer this spectral shift is less likely to be of significance as the lamp to canopy distance is increased.
chazbolin
Well-Known Member
Good eye. I corrected it.
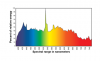
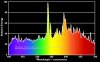
It's hard to tell the difference. But with a CMH peak @ 580 I wasn't drilling down on either of these two charts. I gotta hand it to Hortilux though. It's a nice looking even coverage even though a lot of it is still in visual regions. No idea how they're doing it without the use of a ceramic arc tube??? I understand they're pricey and the recommended replacement integral is 6-9 months but again these are not areas that were analyzed with the V-C-F comparisons anyway.
It's hard to tell the difference. But with a CMH peak @ 580 I wasn't drilling down on either of these two charts. I gotta hand it to Hortilux though. It's a nice looking even coverage even though a lot of it is still in visual regions. No idea how they're doing it without the use of a ceramic arc tube??? I understand they're pricey and the recommended replacement integral is 6-9 months but again these are not areas that were analyzed with the V-C-F comparisons anyway.
tags420
Well-Known Member
Yes it will change based on were the sensor is located which is where I am finding a problem with how these numbers are calculated. As you touched on, for panel makers if that light doesn't get blended/seen by spectroradiometer it will not be as accurate. And if you are geeting your ppf numbers based on this, then they will be very in accurate because of the distance from sensor.Forgive the delay in my response but I stuck with the Integrating Sphere response because on the next update I'm going to publish the formulas used to get these values for each of the 5 metrics that we're used. They will be detailed and will require at a minimum a college level math background to use these formulas properly. I will also provide a simplified explanation to how these values are achieved. Between the advanced math and simplified explanations I expect that this methodology will be seen as sound science since it can be applied by virtue of having just the SDG and the consumed watts of any technology being evaluated.
Regarding the use of a spectroradiometer reading for the majority of lamp types the spectral distribution will remain constant as you move the sensor around underneath lamp. The wattage will change based on sensor distance to the lamp. What you will find with SSL panels is that spectral shifts will occur as the individual diodes distribution patterns will have an effect on the spectrums being displayed depending upon precisely where the sensor is located beneath the panel. Depending on the panel manufacturer this spectral shift is less likely to be of significance as the lamp to canopy distance is increased.
Im starting to get a little worried about how this is all calculated. I will wait to see what you post about math... but the formula I know is
E=hc/lambda...energy=[(planks constant)(speed of light)]/wavelength in meters...and (1w=1J of energy). This will get number of Jules one photon of said nm...now divide the total power output(mW) of the nm by what the energy of 1 photon is for that nm was...that will give how many photons are being emitted per second. Then convert to umol.
Or this link will break each nm down to photons real easy... http://www.calctool.org/CALC/chem/photochemistry/power_photons
But, it keeps coming back to where/how the measurements of mW are taken to be accurate...other wise F.C.V. is just used to show proportions of spectral distribution...not actual output....and that would not be very accurate.
I need the math.
chazbolin
Well-Known Member
Calctools does fine for these conversions. What this type of conversion represents is that it does take a mathematical conversion to account for the energy from photons of different wavelengths. The PAR meter of uMoles won't take those energy levels into consideration whereas V-C-F does. Distance from sensor is not a factor in these V-C-F values. It gives us a generalized of how these technologies compare within these three regions based strictly on the light being used, it's efficiencies and published spectral distribution graphs.
All the formulas and explanations will be on the next update but for now here is Planck Relation equation that Calctools (in moles/s) uses for converting the photon count to intensity in watts and vice versa.
[FONT=&]E = hc/λ[/FONT]
[FONT=&]E = Energy per Photon(λ") [/FONT]
[/FONT]
[FONT=&]h = 6.62697 x 10[SUP]-34[/SUP] J-S (Plancks Constant)[/FONT]
[FONT=&]c = 2.99792458 x 10[SUP]8[/SUP] M/S (Speed of Light)[/FONT]
[FONT=&]λ = photon wavelength[/FONT]
-----
[FONT=&]We are ultimately wanting to derive an equation that will relate light intensity Wattage to photon quantity in µMol as a function of wavelength λ.[/FONT]
[FONT=&]
Photon[SUB]µMol[/SUB] Power(λ[SUB]nm[/SUB]) Watts = hc x Mol x 10[SUP]-6[/SUP]/λ[SUB]nm[/SUB] x 10[SUP]-9[/SUP] M-S[/FONT]
[FONT=&]Where:[/FONT]
[FONT=&]Mol = 6.0221413 x 10[SUP]23[/SUP][/FONT]
[FONT=&]X 10[SUP]-6 [/SUP]Converts photon quantity in Mol to µMol[/FONT]
[FONT=&]X 10[SUP]-9[/SUP] Converts wavelength in M to nM[/FONT]
[FONT=&]For equations going forward: [/FONT]
[FONT=&]Photon quantities will be expressed in µMol and λ in nm.[/FONT]
[FONT=&]Photon[SUB]µMol[/SUB] Power(λ Watts = [/FONT]
[FONT=&]6.62697 X 10[SUP]-34[/SUP] J-S x 2.99792458 X 10[SUP]8[/SUP] M/S x 6.0221413 X 10[SUP]23[/SUP] x 10[SUP]-6[/SUP]/λ[SUB]nm[/SUB] X 10[SUP]-9[/SUP] M-S[/FONT]
[FONT=&]= 119.62657/λ[SUB]nm[/SUB] J/S, J/S = Joules/Second = Watts[/FONT]
Which finally gets to the answer of your question as:
[FONT=&]Photon[SUB]µMol[/SUB] Power(λ = 119.62657/λ[SUB]nm[/SUB] Watts/µMol[/FONT]/s
[FONT=&]Photon[SUB]µMol[/SUB](λQuantity = .0083593 x λ[SUB]nm[/SUB] µMol/s/Watt[/FONT]
All the formulas and explanations will be on the next update but for now here is Planck Relation equation that Calctools (in moles/s) uses for converting the photon count to intensity in watts and vice versa.
[FONT=&]E = hc/λ[/FONT]
[FONT=&]E = Energy per Photon(λ
[FONT=&]h = 6.62697 x 10[SUP]-34[/SUP] J-S (Plancks Constant)[/FONT]
[FONT=&]c = 2.99792458 x 10[SUP]8[/SUP] M/S (Speed of Light)[/FONT]
[FONT=&]λ = photon wavelength[/FONT]
-----
[FONT=&]We are ultimately wanting to derive an equation that will relate light intensity Wattage to photon quantity in µMol as a function of wavelength λ.[/FONT]
[FONT=&]
Photon[SUB]µMol[/SUB] Power(λ[SUB]nm[/SUB]) Watts = hc x Mol x 10[SUP]-6[/SUP]/λ[SUB]nm[/SUB] x 10[SUP]-9[/SUP] M-S[/FONT]
[FONT=&]Where:[/FONT]
[FONT=&]Mol = 6.0221413 x 10[SUP]23[/SUP][/FONT]
[FONT=&]X 10[SUP]-6 [/SUP]Converts photon quantity in Mol to µMol[/FONT]
[FONT=&]X 10[SUP]-9[/SUP] Converts wavelength in M to nM[/FONT]
[FONT=&]For equations going forward: [/FONT]
[FONT=&]Photon quantities will be expressed in µMol and λ in nm.[/FONT]
[FONT=&]Photon[SUB]µMol[/SUB] Power(λ
[FONT=&]6.62697 X 10[SUP]-34[/SUP] J-S x 2.99792458 X 10[SUP]8[/SUP] M/S x 6.0221413 X 10[SUP]23[/SUP] x 10[SUP]-6[/SUP]/λ[SUB]nm[/SUB] X 10[SUP]-9[/SUP] M-S[/FONT]
[FONT=&]= 119.62657/λ[SUB]nm[/SUB] J/S, J/S = Joules/Second = Watts[/FONT]
Which finally gets to the answer of your question as:
[FONT=&]Photon[SUB]µMol[/SUB] Power(λ
[FONT=&]Photon[SUB]µMol[/SUB](λ
chazbolin
Well-Known Member
I'm going to help with the next update to show the math used behind each of the five techniques in that paper. I think you'll find the explanation coupled with the actual equation helpful as an answer to your question. But I believe you mean on a SDG their showing a watts/nm or mW/nm or as a relative intensity.Hey Chaz when you look at an spd. On the xy axis. For intensity / relative energy, when it shows watts/m2. How would you convert that to a percentage? All the hps, cmh, led, mh show a percentage. But all the aquarium bulb companies show it as watts/m2.
hyroot
Well-Known Member
Chaz try the solis tek 4k mh. I've been curious about those. They look to have even distribution and pretty high CRI for digi hid. Not as high as Philips allstart 330 cmh. But that runs on mags.
http://solis-tek.com/digital-lamps/mh4k.html
http://www.ecat.lighting.philips.com/l/lamps/high-intensity-discharge-lamps/outdoor-ceramic-white-light/energy-advantage-cdm-allstart/928601168202_na//
http://solis-tek.com/digital-lamps/mh4k.html
http://www.ecat.lighting.philips.com/l/lamps/high-intensity-discharge-lamps/outdoor-ceramic-white-light/energy-advantage-cdm-allstart/928601168202_na//
tags420
Well-Known Member
So I had the math right. My question of how is the measurement of the mW in the spectral charts achieved still stands? If there is a chance that some light is not being counted because it's at a distance away or lack of containment, I see a problem. The mW value is what is telling the amount of photons, so it matter if all the possible light is getting read.
I think your formula is a little off. You don't multiply to get into µmols...you divide...and that means you have to do it in 2 steps. Order of operations is killing your equations.
1.986716x10^-25/m(nm x 10^-9) will give you the power of one photon...all you need to do is plug in the nm and finish equation.
Then there is the second step/equation that divide the mW value of said nm by the power of one photon in that nm. I can't figure it out all together.
EXAMPLE-based on 1500mW of 630nm. With the known 1J/s=1W and the equation Energy of 1 photon=hc/λ
Step1: gives you the energy(J) per one photon of the selected wavelength(nm).
1.986716x10^-25/(.00000063)= 3.1535175 x10^-19 Joules/photon
Step2: If there is 1500mW of energy, that is 1.5J...divide that total by how much energy makes up 1 photon(answer from step1)...gives the amount of photons in that energy emitted.
Total power= 1500mW...=1.5w..or 1.5J/s
So total power in "J"(1.5) divided by the power of one photon of that nm (3.1535175 x10⁻¹⁹J/photon)
1.5/3.1535175 x10^-19=4.756593293 x 10^18 photons/s...divide into µmols by 6.0221413 x10^17 and that gives you µmols...= 7.89851 µmols of photons coming from the 630nm wavelength per second.
Or just plug and play at calctools site like we said. But I would like to understand it fully by hand first.
chazbolin
Well-Known Member
Hey Tags! There is nothing wrong with either of our methods. I put together some nice clean straightforward equations so all these values you're showing could be easily calculated by having established all the algebraic constants which is more efficient than going through each of the steps your showing. So yes you had the math right but so did I. You just didn't account for the fact we can reach the same conclusions by using reciprocal values that is by dividing by 100 or multiplying by .01. So a comparison of our results shows a difference of only 0.012% which is statistically insignificant. If your concerned that my value might be an under representation when compared to yours consider that when measuring 1000 uMoles the difference between our values would be .1 uMole.
As for your first question on the spectrometry, reading in mW I really do not know how they arrive at those values nor did this paper and V-C-F concentrate on that. I do know that inexpensive field equipment as compared to lab equipment can have errors <10% which provides a far greater variable than what can be achieved through our plotting these values mathematically and showing them in the foreground as usable plant energy within the peak absorbance regions which can be easily interpreted without the background mathematical gymnastics being discussed here.
As for your first question on the spectrometry, reading in mW I really do not know how they arrive at those values nor did this paper and V-C-F concentrate on that. I do know that inexpensive field equipment as compared to lab equipment can have errors <10% which provides a far greater variable than what can be achieved through our plotting these values mathematically and showing them in the foreground as usable plant energy within the peak absorbance regions which can be easily interpreted without the background mathematical gymnastics being discussed here.
tags420
Well-Known Member
I really can't see how you can multiply to in the numerator to get to mols and µmols in the first step...even when reducing to watts right away. When you are turning things into mols/µmols that means you are dividing them into groups of moles(6.0221413 x10^23) then further dividing those mole groups in to even smaller µmols(x10^-6) groups.Hey Tags! There is nothing wrong with either of our methods. I put together some nice clean straightforward equations so all these values you're showing could be easily calculated by having established all the algebraic constants which is more efficient than going through each of the steps your showing. So yes you had the math right but so did I. You just didn't account for the fact we can reach the same conclusions by using reciprocal values that is by dividing by 100 or multiplying by .01. So a comparison of our results shows a difference of only 0.012% which is statistically insignificant. If your concerned that my value might be an under representation when compared to yours consider that when measuring 1000 uMoles the difference between our values would be .1 uMole.
As for your first question on the spectrometry, reading in mW I really do not know how they arrive at those values nor did this paper and V-C-F concentrate on that. I do know that inexpensive field equipment as compared to lab equipment can have errors <10% which is a far greater than can be achieved through our plotting these values mathematically and showing them in the foreground as usable plant energy within the peak absorbance regions which can be easily interpreted without the background mathematical gymnastics being discussed here.
I keep plugging the nm into your final two equations and keep getting the wrong answers...And I check it with calctools.
Do an example please???
EDIT:It's like going back to school and having homework again. Never thought I would miss it but this is kind of fun.
chazbolin
Well-Known Member
For the basic equation we're using to get watts to uMoles run the 630 x 1.5 (watts not mW) x .0083593 = 7.89 radiated uMole/s. Now add the rest of your 610-700nm wavelengths in and you'll have your (F) region values.
[FONT=&]Photon[SUB]µMol[/SUB] Power(λ = 119.62657/λ[SUB]nm[/SUB] Watts/µMol[/FONT]/s
What all of this has shown me is that I've got to give an explanation that includes a SDG and a how this is plotted on a nm x nm basis. My next update will include that.
[FONT=&]Photon[SUB]µMol[/SUB] Power(λ
What all of this has shown me is that I've got to give an explanation that includes a SDG and a how this is plotted on a nm x nm basis. My next update will include that.
chazbolin
Well-Known Member
Something that jumped out at me with the Solis-Tek specs...you've got all that broad band and great coverage in the 520-610 regions and all you've got show for it is a 70 CRI? Based on their graph that should have a CRI >90.Chaz try the solis tek 4k mh. I've been curious about those. They look to have even distribution and pretty high CRI for digi hid. Not as high as Philips allstart 330 cmh. But that runs on mags.
http://solis-tek.com/digital-lamps/mh4k.html
http://www.ecat.lighting.philips.com/l/lamps/high-intensity-discharge-lamps/outdoor-ceramic-white-light/energy-advantage-cdm-allstart/928601168202_na//
hyroot
Well-Known Member
Something that jumped out at me with the Solis-Tek specs...you've got all that broad band and great coverage in the 520-610 regions and all you've got show for it is a 70 CRI? Based on their graph that should have a CRI >90.
the 330 allstarts have cri of 90 , 100 lumens per watt. Supposedly 1300 umole/s at 16 inches away. And 1400 umole/s at 12 inches away.
chazbolin
Well-Known Member
Check it out at the bottom of the page...they list these all at a 70 CRI
http://solis-tek.com/digital-lamps/mh4k.html
http://solis-tek.com/digital-lamps/mh4k.html
hyroot
Well-Known Member
That doesn't make sense. The 600 has 65 cri. Lower than the 400 and 1000. You would think the cri would be higher on the 6 and 1k...
I think they may be fibbing. That might not even be true spd's. Solis teks selling point on hps is how much UV their bulbs have. Yet people will have them in cool tubes and in normal hoods with glass.
bumping spheda broke it down for me in a simpler fashion last night in a pm. So I have a better understanding of cri now. More than I did when I posted about solis tek.
chazbolin
Well-Known Member
Based on your statement I think you can read between the lines here.That doesn't make sense. The 600 has 65 cri. Lower than the 400 and 1000. You would think the cri would be higher on the 6 and 1k...
I think they may be fibbing. That might not even be true spd's. Solis teks selling point on hps is how much UV their bulbs have. Yet people will have them in cool tubes and in normal hoods with glass.
bumping spheda broke it down for me in a simpler fashion last night in a pm. So I have a better understanding of cri now. More than I did when I posted about solis tek.
chazbolin
Well-Known Member
Hey Tags! Equations as promised.
Future updates will build upon this as we plot a SDG and example the radiant wattage equation.
http://www.inda-gro.com/pdf/MeasuringPlantLight.pdf
Future updates will build upon this as we plot a SDG and example the radiant wattage equation.
http://www.inda-gro.com/pdf/MeasuringPlantLight.pdf