Max PPF/PPFD with and without Co2

Icemud420

Well-Known Member
O


Ok I think this would be a great lesson for people to learn some things.

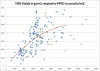
A number of you have referenced the Chandra study, which is a very excellent paper, as the basis for the >1000ppfd being beneficial claims. I will first point out that when referencing a document you should read it in its entirety and understand it beforehand. It is very key to know how it may, or in this case may not, support your position.

Kudos to the first person who identifies what element makes this study somewhat invalid for this purpose. Hint: it is in the Material and Methods section.

There are actually a few flaws, but none the less, its the only cannabis specific study with light intensity I have come across.


Flaws:
Only 1 type of cannabis species was tested (mexican variety)
Only red/blue light was used in the test, of specific wavelength, not full spectrum
The leaf samples were only given about 45 minutes of light, where photosynthesis peaks usually right before mid day sun.
The readings of PPFD were only on upper leaves using a closed device/system for measuring photosynthesis, but didn't take into consideration intra canopy measurements, or intensities within the intracanopy.
PPFD results were only measured within the range of 660-675nm. (not even the peak wavelengths for absorption)

Those are the flaws I found upon just quickly re-reading the study... so yes, there are quite a few flaws, but also we have to consider that there are very little light research studies done on cannabis in general, so the data that is gathered from this is useful, to some extent.


and after seeing your second hint, yea, they didn't use Far Red to create the emerson effect which would have influenced the results.
 
Last edited:

PhotonFUD

Well-Known Member
There are actually a few flaws, but none the less, its the only cannabis specific study with light intensity I have come across.


Flaws:
Only 1 type of cannabis species was tested (mexican variety)
Only red/blue light was used in the test, of specific wavelength, not full spectrum
The leaf samples were only given about 45 minutes of light, where photosynthesis peaks usually right before mid day sun.
The readings of PPFD were only on upper leaves using a closed device/system for measuring photosynthesis, but didn't take into consideration intra canopy measurements, or intensities within the intracanopy.
PPFD results were only measured within the range of 660-675nm. (not even the peak wavelengths for absorption)

Those are the flaws I found upon just quickly re-reading the study... so yes, there are quite a few flaws, but also we have to consider that there are very little light research studies done on cannabis in general, so the data that is gathered from this is useful, to some extent.


and after seeing your second hint, yea, they didn't use Far Red to create the emerson effect which would have influenced the results.
Nailed it.

The key was the red spectrum. Without Emerson, it could be anywhere from only 30-40% efficient which doesn't make it a direct correlation to a real world control. Plus with the hatred for monos, I thought it would have been quickly detected.

Also, it is just measuring the effect, not the overall outcome. Only the leaves were exposed for a short time frame and analysis performed.

But having said all of that, it does lead to other research. Keep in mind the study was done in 2008 using older led tech. Like I said a few times now, lots of opportunity to learn new things.
 

Icemud420

Well-Known Member
Nailed it.

The key was the red spectrum. Without Emerson, it could be anywhere from only 30-40% efficient which doesn't make it a direct correlation to a real world control. Plus with the hatred for monos, I thought it would have been quickly detected.

Also, it is just measuring the effect, not the overall outcome. Only the leaves were exposed for a short time frame and analysis performed.

But having said all of that, it does lead to other research. Keep in mind the study was done in 2008 using older led tech. Like I said a few times now, lots of opportunity to learn new things.
I've seen on other forums mention of people questioning the work of Chandra so I always take it as good information, with more potential... as you pointed out, there are flaws, but that is pretty much the nature of research. One study proves something, years later it gets dis proven or adjusted, but overall it increases our knowledge of the whole. I've seen it just with my own research and understanding and even in the LED grow light market moving from 1 red, 1 blue, to 2 red, 2 blue, to mulit spectrum mono, to cobs, and now quantum dot tech...

Just over the last few years, and with the progression of mono LED technology, I have seen quite a bit of new plant lighting research being published so I definitely think that within the next decade we will be able to utilize the technology to its full potential. A couple years ago I tested some crappy rebranded LED's (monos) but they had programmability for different light schedules, dimming and spectrum changes... I was like cool... but what is the purpose since we don't know how to manipulate the plants to our benefit yet.. but I see that answer coming with the steady research coming in, and with more states going online and money flooding the industry, its only a matter of time to fully understand our beloved plant :)
 

Huygens

Active Member
In my humble experience, spectrum is a fine tuning tool. Nothing else really. The weight comes from RAW photons, plain energy. Sure you can play with photomorphogenesis. It depends on a series of variables not just Co2 in my shy opinion, it has a lot to do with genetics. I have a bunch of bleached leaves next to dark green ones at the same height and ambient temps humidity and micro moles.

The one thing I can say for sure is that when you have the right temp to humidity ratio and the media is always moist, meaning 30C 1500um with 1500ppm of Co2, is difficult to bleach Sativas. Indicas and Kush varieties you have to go under 800 umoles for the first weeks of flower... Let them grow into the lights gently. And see how each pheno reacts...

It comes down to feeling your plants and what they like. Or don't.

namaste
 
Last edited:

PhotonFUD

Well-Known Member
I've seen on other forums mention of people questioning the work of Chandra so I always take it as good information, with more potential... as you pointed out, there are flaws, but that is pretty much the nature of research. One study proves something, years later it gets dis proven or adjusted, but overall it increases our knowledge of the whole. I've seen it just with my own research and understanding and even in the LED grow light market moving from 1 red, 1 blue, to 2 red, 2 blue, to mulit spectrum mono, to cobs, and now quantum dot tech...

Just over the last few years, and with the progression of mono LED technology, I have seen quite a bit of new plant lighting research being published so I definitely think that within the next decade we will be able to utilize the technology to its full potential. A couple years ago I tested some crappy rebranded LED's (monos) but they had programmability for different light schedules, dimming and spectrum changes... I was like cool... but what is the purpose since we don't know how to manipulate the plants to our benefit yet.. but I see that answer coming with the steady research coming in, and with more states going online and money flooding the industry, its only a matter of time to fully understand our beloved plant :)
Well picture this. A bunch of kids get together and come up with a way to grow pot in their dorm room using lab equipment and the blessing of their prof.

NASA was talking about only red wavelength led at the time so it would have seemed reasonable to just use red for the study.

We know better today that the full spectrum is needed in some sort of distribution.

US research is significantly far behind other modern countries due to, primarily as you point out, the legalities. A lot has been done in other countries where the laws were relaxed or research was permitted for institutions. You have to go look for it but it is there and more coming out all of the time.

More importantly you mention learning on your own. That is the best way.
 

CobKits

Well-Known Member
lets call it like we see it. labs are cool but i have zero doubt that this forum and one or two others (same people really) are on the literal bleeding edge. ability to intelligently understand controlled experiments and apply that understanding to real-world situations> report> learn> tweak> repeat. there is a deep culture in our community stemming from the outlaw days where you had to apply off-the shelf tech to an artificial environment and figure out what worked FOR YOU, before there was an internet or legal climate to compare notes with others.
 

wietefras

Well-Known Member
That "Chandra" chart has always been a bit suspect. All in all it's pretty much like any light response curve, but it seems a bit too steep. People who tried different light intensities (including myself) did not see the exponential gains in yield/Watt which you would expect from that chart when lowering the light levels. In reality the relation between light intensity seemed much more linear between 400umol/s/m2 and 1000umol/s/m2.

A couple of years ago on the YOR (Yield-O-Rama) site they were looking into which factors attributed most to increased yields. For this they collected a lot of yield information from many growers. In total something like 175 grow reports were submitted.

I plotted those results in a chart showing the yield in g/m2 on the vertical axis and estimated light intensity in umol/s/m2 on the horizontal axis. The red line is a smoothed average. Blue points are without CO2 and green with CO2.

YOR Yields in g-m2 related to PPFD in umol-s-m2.png
This is based on grow reports with different genetics, different lights, different temperatures, different medium (hydro/soil), different stock (cuttings vs seeds) etc etc etc. Yet on average it looks pretty much like the chart we have all been using and it shows that adding more light well over 1000umol/s/m2 still increases yield. Only above 1500 umol/s/m2 does it really seem to taper off, but there is not enough data there to say anything definitive.

Still, the biggest difference compared to the "Chandra" chart, is that it indeed shows a much more linear slope between 400 and 1000 umol/s/m2 range.Based on the average line you could expect an average yield of 0.56g/umol/s/m2 @ 400umol/s/m2 and 0.48g/g/umol/s/m2 @ 800umol/s/m2. That would make it around 15% less efficient to run with 800PPFD instead of 400PPFD, but you would also get 70% more yield from the same space. Most likely more compact and harder buds too under the higher light intensity. So less grows needed for a certain amount, more yield from the same area and better (higher priced) product overall. That's why people tend to average around the 600 to 800umol range instead of 400.

It also demonstrates another major mistake in FUD's reasoning that the "optimal" value would be the saturation point. This chart indicates the average saturation point for cannabis is around 1500umol/s/m2. Yet virtually no one is growing at this "optimal" value. Or the other way around, even if the saturation point was around 400umol, it would be much more efficient to grow at 200umol/s/m2.

:edit: Added distinction between CO2 enrichment and no CO2
 
Last edited:

VegasWinner

Well-Known Member
damn, this is a lot of thinking. I started using CO2 cartridges for paintball gun cartridges back in the r day. I would turn off my fan for 15 minutes and pop a few cartridges into the grow room and wait 15 minutes before turning the exhaust fans back on. Later I got a CO2 tank along with my welding gas tanks and would do the same with the CO2 tank not the welding gas, just cheaper. Now I guess a controller to turn off fans, turn on gas, allow saturation, turn off gas and turn fans back on. Sounds like a job for a controller with a CO2 sensor, and a fan controller. peace
 

VegasWinner

Well-Known Member
Yes.. But you have to move to California.

http://oaksterdamuniversity.com

This is where professional growers come from:bigjoint:
Or you can study under a Master like I did. I studied under BOG, Bushy Old Grower for three years, and studied other professional growers, as well. I did live in the Bay area for a few years, and went to Oakland on a regular basis. peace
 

MeGaKiLlErMaN

Well-Known Member
That "Chandra" chart has always been a bit suspect. All in all it's pretty much like any light response curve, but it seems a bit too steep. People who tried different light intensities (including myself) did not see the exponential gains in yield/Watt which you would expect from that chart when lowering the light levels. In reality the relation between light intensity seemed much more linear between 400umol/s/m2 and 1000umol/s/m2.

A couple of years ago on the YOR (Yield-O-Rama) site they were looking into which factors attributed most to increased yields. For this they collected a lot of yield information from many growers. In total something like 175 grow reports were submitted.

I plotted those results in a chart showing the yield in g/m2 on the vertical axis and estimated light intensity in umol/s/m2 on the horizontal axis. The red line is a smoothed average. Blue points are without CO2 and green with CO2.

View attachment 3788419
This is based on grow reports with different genetics, different lights, different temperatures, different medium (hydro/soil), different stock (cuttings vs seeds) etc etc etc. Yet on average it looks pretty much like the chart we have all been using and it shows that adding more light well over 1000umol/s/m2 still increases yield. Only above 1500 umol/s/m2 does it really seem to taper off, but there is not enough data there to say anything definitive.

Still, the biggest difference compared to the "Chandra" chart, is that it indeed shows a much more linear slope between 400 and 1000 umol/s/m2 range.Based on the average line you could expect an average yield of 0.56g/umol/s/m2 @ 400umol/s/m2 and 0.48g/g/umol/s/m2 @ 800umol/s/m2. That would make it around 15% less efficient to run with 800PPFD instead of 400PPFD, but you would also get 70% more yield from the same space. Most likely more compact and harder buds too under the higher light intensity. So less grows needed for a certain amount, more yield from the same area and better (higher priced) product overall. That's why people tend to average around the 600 to 800umol range instead of 400.

It also demonstrates another major mistake in FUD's reasoning that the "optimal" value would be the saturation point. This chart indicates the average saturation point for cannabis is around 1500umol/s/m2. Yet virtually no one is growing at this "optimal" value. Or the other way around, even if the saturation point was around 400umol, it would be much more efficient to grow at 200umol/s/m2.

:edit: Added distinction between CO2 enrichment and no CO2

I will eventually get over 1500PPFD... Currently sitting at 1200ish. My thinking regarding that chart is this: I have not seen people grow with anything higher than 1000PPFD and the last person I saw do that was Growmau5. He did pretty well with his metrics (its his season 3 final video) Im testing to see if that as because of the distance or if light intensity was just not being utilized. If I dont get a good g/m^2 then ill reassess why what ever plant did the best.. It may come down to not needing as much PPFD as I used... or it might work out that this chart might be flawed (you can see alot of anomalies regardless of the grow method that should be specified by different keys)

I have seen a person beat a 1000W Gravita Pro with T5 Lighting, which is why I think PPFD might be more important than the chart or PPF in general. I cant find the link for it but I have seen it before If someone else remembers where its at please post it. It was on this site. Also another thing to consider there are LED t8s and T5s that match the lumen output of the standard T5 but at half the wattage.
 

CobKits

Well-Known Member
Also another thing to consider there are LED t8s and T5s that match the lumen output of the standard T5 but at half the wattage.
well not exactly. brightest ive seen is 2100 lm/17W/4 ft tube. T5s are like 4000-4500 lm/54W. so there is definitely a reduction there (factor of 2) but youre cutting your wattage by a factor of 3
 

wietefras

Well-Known Member
I have seen a person beat a 1000W Gravita Pro with T5 Lighting, which is why I think PPFD might be more important than the chart or PPF in general. I cant find the link for it but I have seen it before If someone else remembers where its at please post it. It was on this site. Also another thing to consider there are LED t8s and T5s that match the lumen output of the standard T5 but at half the wattage.
It's not a case of "more important", but of different applications. You use PPF to compare lights and you use PPFD to measure how much light the plants are getting in your own grow room.

PPF doesn't depend on anything. It's a measure of total light output and can therefore be uses as an objective measure comparing lights
PPFD depends on a ton of things in your grow room and cannot be use for comparing

In the end PPFD is what counts for the plants, but when you want to see which light is most efficient you need to look at PPF. Basically you divide PPF by the surface area after deducting wall losses.

Those people who "beat" HPS lights tend to do so by getting only 0.5g/W under the HPS. That's like running against a sprinter with a broken leg and claiming you beat a gold medal champion.
 

MeGaKiLlErMaN

Well-Known Member
It's not a case of "more important", but of different applications. You use PPF to compare lights and you use PPFD to measure how much light the plants are getting in your own grow room.

PPF doesn't depend on anything. It's a measure of total light output and can therefore be uses as an objective measure comparing lights
PPFD depends on a ton of things in your grow room and cannot be use for comparing

In the end PPFD is what counts for the plants, but when you want to see which light is most efficient you need to look at PPF. Basically you divide PPF by the surface area after deducting wall losses.

Those people who "beat" HPS lights tend to do so by getting only 0.5g/W under the HPS. That's like running against a sprinter with a broken leg and claiming you beat a gold medal champion.
I know and understand, what I'm saying is if you hit 850PPFD with 600W in the same area as using 1000W while getting 600PPFD. Regardless of efficiency of the plant gets more for less that's a no brainer. I know that over all the umol/W is a good guideline but it can get skewed from what your plants are really getting due to fall off.
 

mauricem00

Well-Known Member
Easy answer, It will always help... but its not really needed till youre pushing way more light than we currently do... The drop off on this chart is where you need CO2. Supplementation will never hurt... but its not always as cost effective as people think. Even shorter answer... after 1500PPFD at 86F... good luck hitting that lol


View attachment 3788162
from this and other chart it appears that 500 PPFD would give you the highest efficiency.it seems that you would need to triple your power to get a 37% increase in efficiency. might be worth the added cost for cooling and lighting for commercial growers.but not for MMJ PU growers. PPFD does not factor in spectrum and actually favors red light in the same way that lumens favors green light.discussing theory may be entertaining but the only real way to evaluate lights is in a grow room. some high end LEDs have high PPFD numbers but in youtube videos by the manufacturer plant growth is not impressive and there still seems to be a lot of disagreement about spectrum. some very expensive lights use only 3 or 4 bands.some cheap ones use up to 12 bands. others use white leds mixed with deep reds. still a lot of disagreement and wild claims in this field. don't see this with other lighting systems. guess LEDs are still going thru birthing pains and still evolving.
 
Top